


Last Updated on January 29, 2026 by Nurseslab.in Editorial Team
Factor analysis is a statistical method used to identify underlying relationships among a large set of variables. It reduces the dimensionality of data by grouping variables that are highly correlated into factors, which represent the shared variance among the variables. Factor analysis is widely used in fields such as psychology, education, marketing, and social sciences to simplify data, develop theories, or construct measurement instruments.

This article explores the steps, methods, and practical examples of factor analysis, highlighting its significance and applications.
Factor Analysis
Factor analysis is a multivariate statistical technique that seeks to uncover latent structures (factors) underlying observed variables. The goal is to reduce a large dataset into a smaller set of factors while retaining as much information as possible.
Key Features:
- Dimensionality Reduction: Summarizes numerous variables into fewer factors.
- Latent Variables: Identifies underlying constructs not directly observable.
- Exploratory or Confirmatory: Can be used to explore data or test hypotheses.
Example: In a psychological study, factor analysis might group responses from a personality survey into broader traits like “openness” or “conscientiousness.”
Importance of Factor Analysis
- Simplifies Complex Data: Reduces redundancy among correlated variables.
- Construct Validity: Assesses whether variables measure the intended constructs.
- Improves Interpretation: Helps researchers identify patterns and relationships.
- Data Reduction: Optimizes datasets for further analysis or model development.
- Supports Theory Development: Identifies structures or dimensions underlying a phenomenon.
Types of Factor Analysis
1. Exploratory Factor Analysis (EFA)
- Purpose: Discovers the underlying structure of a dataset without prior assumptions.
- Use Case: Initial stages of research when relationships between variables are unknown.
- Example: Exploring the dimensions of customer satisfaction based on survey data.
Objectives of Exploratory Factor Analysis
• The primary objectives of an EFA are to determine
1. The number of common factors influencing a set of measures.
2. The strength of the relationship between each factor and each observed measure.
• Some common uses of EFA are to
- Identify the nature of the constructs underlying responses in a specific content area.
- Determine what sets of items “hang together” in a questionnaire.
- Demonstrate the dimensionality of a measurement scale. Researchers often wish to develop scales that respond to a single characteristic.
- Determine what features are most important when classifying a group of items.
- Generate “factor scores” representing values of the underlying constructs for use in other analyses
2. Confirmatory Factor Analysis (CFA)
- Purpose: Tests whether the data fit a predefined factor structure based on theoretical expectations.
- Use Case: Later stages of research to validate hypothesized relationships.
- Example: Verifying whether a test measures three distinct cognitive abilities: verbal, numerical, and spatial reasoning.
Combining Exploratory and Confirmatory Factor Analyses
- In general, you want to use EFA if you do not have strong theory about the constructs underlying responses to your measures and CFA if you do.
- It is reasonable to use an EFA to generate a theory about the constructs underlying your measures and then follow this up with a CFA, but this must be done using separate data sets. You are merely fitting the data (and not testing theoretical constructs) if you directly put the results of an EFA directly into a CFA on the same data. An acceptable procedure is to perform an EFA on one half of your data and then test the generality of the extracted factors with a CFA on the second half of the data.
- If you perform a CFA and get a significant lack of fit, it is perfectly acceptable to follow this up with an EFA to try to locate inconsistencies between the data and your model. However, you should test any modifications you decide to make to your model on new data.
How to do Factor Analysis (Factor Analysis Steps)?
Factor analysis is a statistical method used to describe variability among observed, correlated variables in terms of a potentially lower number of unobserved variables called factors. Here are the general steps involved in conducting a factor analysis:

1. Determine the Suitability of Data for Factor Analysis
- Bartlett’s Test: Check the significance level to determine if the correlation matrix is suitable for factor analysis.
- Kaiser-Meyer-Olkin (KMO) Measure: Verify the sampling adequacy. A value greater than 0.6 is generally considered acceptable.
2. Choose the Extraction Method
- Principal Component Analysis (PCA): Used when the main goal is data reduction.
- Principal Axis Factoring (PAF): Used when the main goal is to identify underlying factors.
3. Factor Extraction
- Use the chosen extraction method to identify the initial factors.
- Extract eigenvalues to determine the number of factors to retain. Factors with eigenvalues greater than 1 are typically retained in the analysis.
- Compute the initial factor loadings.
4. Determine the Number of Factors to Retain
- Scree Plot: Plot the eigenvalues in descending order to visualize the point where the plot levels off (the “elbow”) to determine the number of factors to retain.
- Eigenvalues: Retain factors with eigenvalues greater than 1.
5. Factor Rotation
- Orthogonal Rotation (Varimax, Quartimax): Assumes that the factors are uncorrelated.
- Oblique Rotation (Promax, Oblimin): Allows the factors to be correlated.
- Rotate the factors to achieve a simpler and more interpretable factor structure.
- Examine the rotated factor loadings.
6. Interpret and Label the Factors
- Analyze the rotated factor loadings to interpret the underlying meaning of each factor.
- Assign meaningful labels to each factor based on the variables with high loadings on that factor.
7. Compute Factor Scores (if needed)
- Calculate the factor scores for each individual to represent their value on each factor.
8. Report and Validate the Results
Validate the results using additional data or by conducting a confirmatory factor analysis if necessary.
Report the final factor structure, including factor loadings and communalities.
Methods of Factor Analysis
1. Principal Component Analysis (PCA)
- Purpose: Summarizes all variance in the data, including unique and error variance.
- Use Case: Used for data reduction rather than exploring latent constructs.
- Example: Reducing a large dataset of 20 financial metrics into 3-4 core indicators.
2. Common Factor Analysis
- Purpose: Explains shared variance among variables, excluding unique and error variance.
- Use Case: Identifies latent constructs influencing observed variables.
- Example: Identifying dimensions of mental health (e.g., anxiety, depression) based on a psychological survey.
3. Maximum Likelihood Factor Analysis
- Purpose: Estimates factors that maximize the likelihood of the observed data.
- Use Case: Used in confirmatory contexts or when data assumptions are met.
- Example: Testing a theoretical model of leadership traits.
4. Image Factor Analysis
- Purpose: Extracts factors using regression-based methods.
- Use Case: Suitable for exploratory research requiring computational simplicity.
Examples of Factor Analysis Applications
1. Education Research
Objective: Understand student performance dimensions.
- Method: EFA.
- Process: Analyze test scores across subjects.
- Result: Identify factors such as “logical reasoning” and “language skills” contributing to performance.
2. Marketing
Objective: Explore customer satisfaction drivers.
- Method: PCA.
- Process: Analyze survey responses on product quality, pricing, and service.
- Result: Group variables into factors like “product attributes” and “customer service.”
3. Psychology
Objective: Develop a personality inventory.
- Method: CFA.
- Process: Validate whether survey questions align with the Big Five personality traits.
- Result: Confirm factors like “openness” and “extraversion.”
4. Healthcare
Objective: Identify dimensions of patient satisfaction.
- Method: Common Factor Analysis.
- Process: Analyze responses from patient feedback forms.
- Result: Factors include “quality of care,” “communication,” and “facility cleanliness.”
Advantages of Factor Analysis
- Data Reduction: Simplifies datasets by grouping variables into fewer factors.
- Pattern Recognition: Unveils hidden structures or relationships among variables.
- Construct Validity: Helps test or develop measurement instruments.
- Versatility: Applicable across various disciplines.
- Improved Interpretability: Enhances understanding by consolidating redundant variables.
Limitations of Factor Analysis
- Sample Size Requirements: Requires large datasets to produce reliable results.
- Subjectivity in Interpretation: Naming and defining factors may involve researcher bias.
- Assumptions: Assumes linear relationships and normally distributed variables.
- Sensitivity to Outliers: Outliers can distort factor loadings and results.
- Not Predictive: Does not establish causal relationships between variables.
Tips for Effective Factor Analysis
- Check Assumptions: Ensure data meets criteria for correlation and normality.
- Standardize Data: Normalize variables if they are on different scales.
- Use Visual Aids: Employ scree plots and rotation methods to aid interpretation.
- Cross-Validate Results: Validate findings with a different dataset or statistical method.
- Be Transparent: Clearly explain methods, assumptions, and limitations when reporting results.
Why do we need Factor Analysis?
Factorial analysis serves several purposes and objectives in statistical analysis:
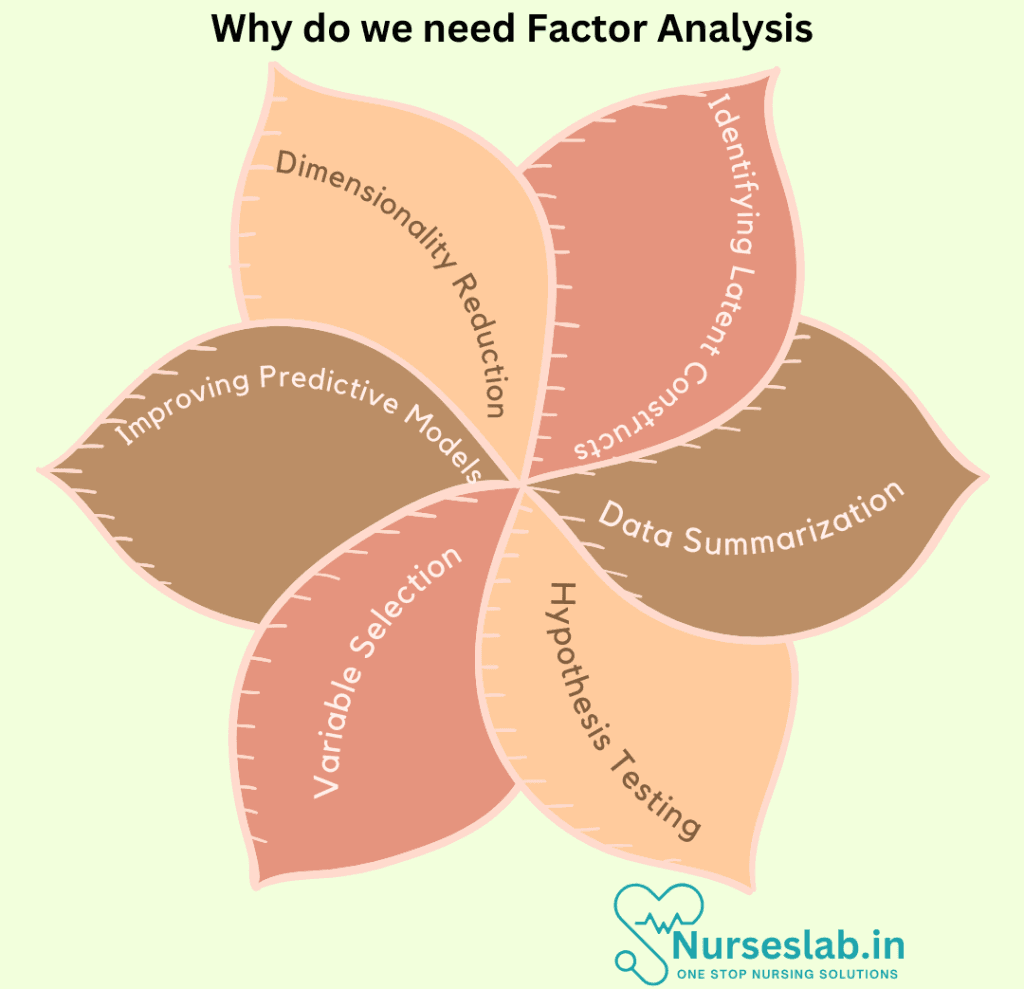
1.Dimensionality Reduction:
Factor analysis helps in reducing the number of variables under consideration by identifying a smaller number of underlying factors that explain the correlations or covariances among the observed variables. This simplification can make the data more manageable and easier to interpret.
2.Identifying Latent Constructs:
It allows researchers to identify latent constructs or underlying factors that may not be directly observable but are inferred from patterns in the observed data. These latent constructs can represent theoretical concepts, such as personality traits, attitudes, or socioeconomic status.
3.Data Summarization:
By condensing the information from multiple variables into a smaller set of factors, factor analysis provides a more concise summary of the data while retaining as much relevant information as possible.
4.Hypothesis Testing:
Factor analysis can be used to test hypotheses about the underlying structure of the data. For example, researchers may have theoretical expectations about how variables should be related to each other, and factor analysis can help evaluate whether these expectations are supported by the data.
5.Variable Selection:
It aids in identifying which variables are most important or relevant for explaining the underlying factors. This can help in prioritizing variables for further analysis or for developing more parsimonious models.
6.Improving Predictive Models:
Factor analysis can be used as a preprocessing step to improve the performance of predictive models by reducing multicollinearity among predictors and capturing the shared variance among variables more efficient.
REFERENCES
- DeCoster, Jamie. (1998). Overview of Factor Analysis., https://www.researchgate.net/publication/255620387_Overview_of_Factor_Analysis/citation/download
- Hervé Abdi (2003), “Factor Rotations in Factor Analyses,” In: Lewis-Beck M., Bryman, A., Futing T. (Eds.) (2003). Encyclopedia of Social Sciences Research Methods. Thousand Oaks (CA): Sage.
- Brown, Michael W., (2001) “An Overview of Analytic Rotation in Exploratory Factor Analysis,” Multivariate Behavioral Research, 36 (1), 111-150.
- Costello, Anna B. and Osborne, Jason (2005) “Best practices in exploratory factor analysis: four recommendations for getting the most from your analysis,” Practical Assessment, Research, and Evaluation: Vol. 10 , Article 7
- Tabachnick, B. G., & Fidell, L. S. (2019). Using Multivariate Statistics. Pearson Education.
- Hair, J. F., Black, W. C., Babin, B. J., & Anderson, R. E. (2018). Multivariate Data Analysis. Cengage Learning.
- Costello, A. B., & Osborne, J. W. (2005). Best Practices in Exploratory Factor Analysis. Practical Assessment, Research, and Evaluation.
- Fabrigar, L. R., & Wegener, D. T. (2012). Exploratory Factor Analysis. Oxford University Press.
- Hatcher, L. (1994). A step-by-step approach to using the SAS system for factor analysis and structural equation modeling. Cary, NC: SAS Institute Press.
- Kim, J. O., & Mueller, C. W. (1978). Factor analysis: Statistical methods and practical issues. (Sage University Paper Series on Quantitative Applications n the Social Sciences, series no. 07-014). Newbury Park, CA: Sage.
- Wegener, D. T., & Fabrigar, L. R. (in press). Analysis and design for nonexperimental data: Addressing causal and noncausal hypotheses. In R. T. Reis & C. M. Judd (Eds.),
Stories are the threads that bind us; through them, we understand each other, grow, and heal.
JOHN NOORD
Connect with “Nurses Lab Editorial Team”
I hope you found this information helpful. Do you have any questions or comments? Kindly write in comments section. Subscribe the Blog with your email so you can stay updated on upcoming events and the latest articles.


