


Inferential Statistics is a branch of statistics that uses sample data to make generalizations, predictions, or inferences about a larger population. Unlike descriptive statistics, which summarize data, Inferential Statistics go beyond the data at hand to estimate parameters, test hypotheses, and predict future trends.
This article delves into the definition of inferential statistics, its types, methods, and practical examples, offering insights into how it supports decision-making in various fields.
Inferential Statistics
Inferential statistics involves techniques used to infer characteristics of a population based on sample data. It relies on probability theory to evaluate the reliability and generalizability of these inferences.
Key Characteristics of Inferential Statistics:
- Generalization: Extends conclusions from a sample to a population.
- Hypothesis Testing: Evaluates claims or predictions about a population.
- Estimation: Provides parameter estimates (e.g., population mean, proportion) using sample statistics.
- Uncertainty Measurement: Quantifies confidence and error margins.
Example: Using a survey of 500 people to estimate the voting preferences of an entire city’s population.
Importance of Inferential Statistics
- Informed Decision-Making: Provides evidence-based predictions and insights.
- Efficient Analysis: Draws conclusions without studying the entire population.
- Supports Research: Facilitates hypothesis testing and model building.
- Addresses Variability: Accounts for random variation and sampling errors.
Types of Inferential Statistics
Inferential statistics can be classified into hypothesis testing and regression analysis. Hypothesis testing also includes the use of confidence intervals to test the parameters of a population. Given below are the different types of inferential statistics.
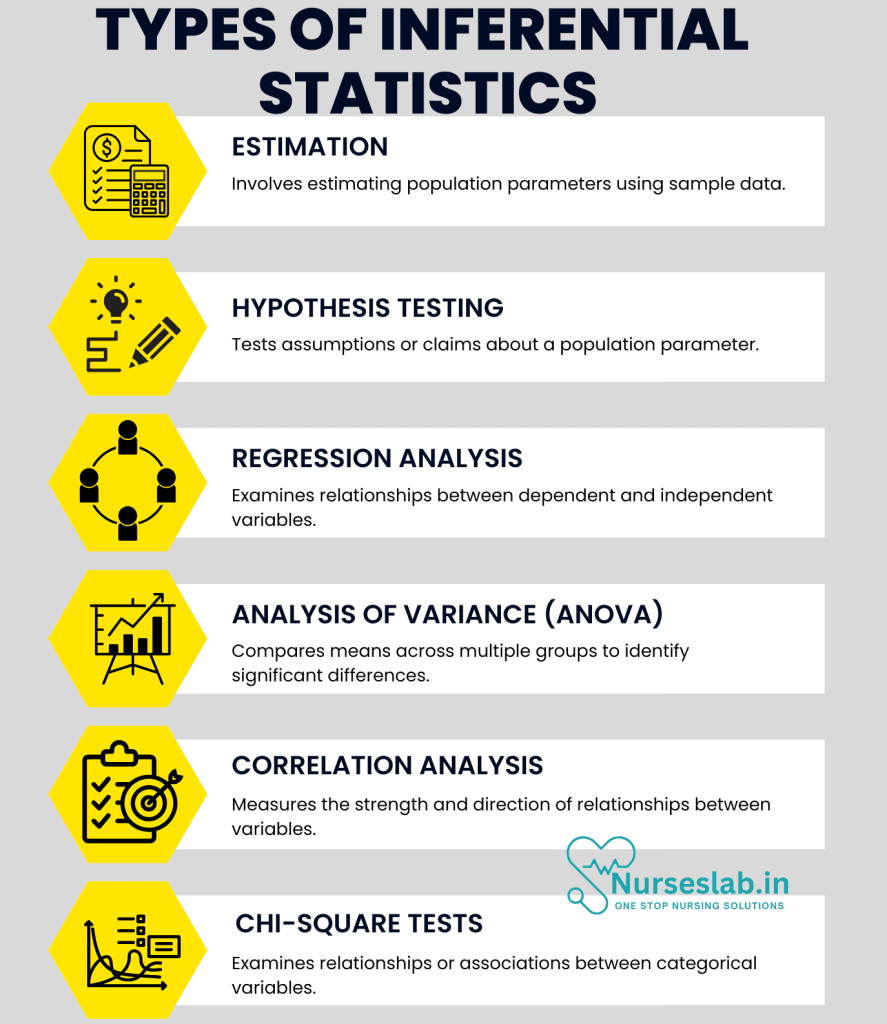
1. Estimation
- Description: Involves estimating population parameters (e.g., mean, proportion) using sample data.
- Techniques:
- Point Estimation: Provides a single value estimate (e.g., sample mean).
- Interval Estimation: Offers a range of values, often with a confidence interval.
- Example: Estimating the average income of a country based on a sample survey.
2. Hypothesis Testing
- Description: Tests assumptions or claims about a population parameter.
- Techniques:
- Null Hypothesis (H₀): Assumes no effect or difference.
- Alternative Hypothesis (H₁): Proposes a specific effect or difference.
- Example: Testing whether a new drug is more effective than an existing treatment.
3. Regression Analysis
- Description: Examines relationships between dependent and independent variables.
- Techniques:
- Linear Regression: Models linear relationships.
- Multiple Regression: Considers multiple predictors simultaneously.
- Example: Predicting house prices based on size, location, and number of rooms.
4. Analysis of Variance (ANOVA)
- Description: Compares means across multiple groups to identify significant differences.
- Example: Testing whether three teaching methods produce different student outcomes.
5. Correlation Analysis
- Description: Measures the strength and direction of relationships between variables.
- Example: Analyzing the correlation between study time and test scores.
6. Chi-Square Tests
- Description: Examines relationships or associations between categorical variables.
- Example: Testing whether gender and job preference are independent of each other.
Methods of Inferential Statistics
1. Sampling Techniques
- Simple Random Sampling: Each individual has an equal chance of selection.
- Stratified Sampling: Population divided into strata, with samples taken from each.
- Systematic Sampling: Every nth individual in the population is selected.
- Example: Sampling 100 households in a city to estimate average water consumption.
2. Probability Distributions
- Normal Distribution: Bell-shaped curve; central in statistical analyses.
- Binomial Distribution: Models outcomes with two possible results (e.g., success/failure).
- Example: Using a normal distribution to model exam scores.
3. Confidence Intervals
- Description: Provides a range within which a population parameter is expected to lie with a specified confidence level (e.g., 95%).
- Example: Stating that the average income is $50,000 ± $2,000 at a 95% confidence level.
4. Hypothesis Testing Procedures
- Steps:
- State null and alternative hypotheses.
- Choose significance level (e.g., 0.05).
- Perform a statistical test (e.g., t-test, z-test).
- Interpret p-value and decide whether to reject H₀.
- Example: Testing whether students score better after implementing a new curriculum.
5. Statistical Tests
- T-Test: Compares means between two groups.
- F-Test: Compares variances or more than two group means.
- Chi-Square Test: Evaluates relationships between categorical variables.
Steps for Evaluating its Efficacy:
Inferential statistics is very useful and cost-effective as it can make inferences about the population without collecting the complete data. Some of the steps for evaluating its efficacy is as follows
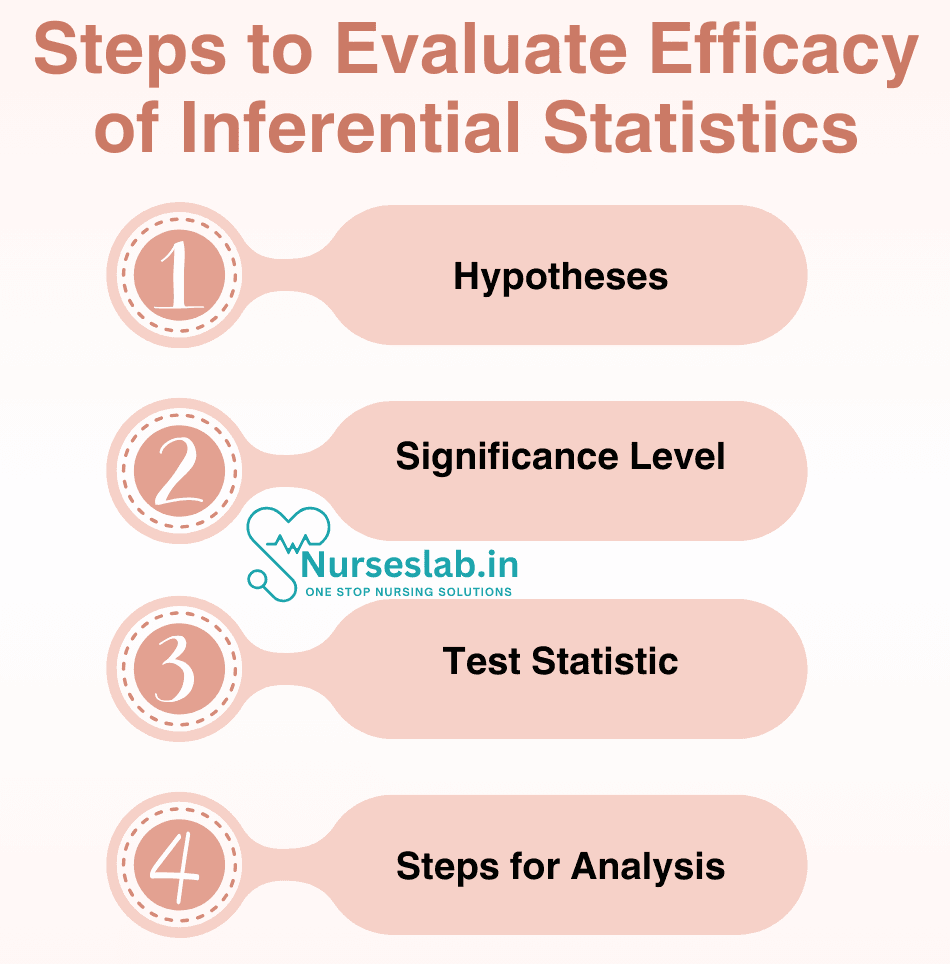
1. Hypotheses:
- Null Hypothesis (H0): New delivery optimization algorithm does not reduce delivery times compared to the existing system.
- Alternative Hypothesis (H1): New delivery optimization algorithm reduces delivery times compared to the existing system.
2. Significance Level:
Let’s set the significance level at α = 0.05, indicating a 5% chance of rejecting the null hypothesis when it is actually true. (It is the probability of rejecting the null hypothesis when it is actually true)
- Example: New delivery system makes deliveries faster and we wrongly conclude that it does (when it actually doesn’t), that’s a Type I error.
- Example: If the new delivery system actually makes deliveries faster, but our test doesn’t show it, that’s a Type II error. We would miss out on improving the delivery system because we failed to detect its benefit.
3. Test Statistic:
Will be based on the difference in mean delivery times between two groups:
- Group A: 50 orders processed using the current system.
- Group B: 50 orders processed using the new algorithm.
4. Steps for Analysis
- Collect Data: Record delivery times for 100 orders, split into two groups: 50 orders using the old system and 50 using the new algorithm.
- Calculate the Test Statistic: Compute the mean delivery time for each group, the standard deviation, and the difference in means between the two groups.
- Assumptions Check: Ensure the data are approximately normal (use Central Limit Theorem for larger samples).
- Determine Critical Value or p-value: Perform a t-test or z-test. If the p-value is less than the significance level, reject the null hypothesis and conclude the new algorithm improves delivery times. If p-value is greater, fail to reject the null hypothesis.
- Make a Decision: If p < α, reject the null hypothesis and confirm the new algorithm is effective. If p ≥ α, conclude no significant improvement.
- Confidence Intervals: If the confidence interval is [-5 minutes, -2 minutes], it suggests that deliveries with the new algorithm are consistently faster by 2 to 5 minutes.
Examples of Inferential Statistics
1. Healthcare Research
- Objective: Test the effectiveness of a new vaccine.
- Method: Conduct clinical trials on a sample of patients.
- Outcome: Infer vaccine efficacy for the entire population based on sample results.
2. Marketing Analysis
- Objective: Predict customer preferences.
- Method: Use regression analysis on survey data.
- Outcome: Estimate the likelihood of customers buying a product based on their demographics.
3. Environmental Studies
- Objective: Assess air quality in a city.
- Method: Sample air pollution levels at specific locations.
- Outcome: Infer overall air quality trends for the city.
4. Educational Research
- Objective: Determine the impact of a new teaching method.
- Method: Use ANOVA to compare test scores across three different classrooms.
- Outcome: Identify significant differences in learning outcomes.
Inferential Statistics vs Descriptive Statistics
Descriptive and inferential statistics are used to describe data and make generalizations about the population from samples. The table given below lists the differences between inferential statistics and descriptive statistics.
| Inferential Statistics | Descriptive Statistics |
|---|---|
| Inferential statistics are used to make conclusions about the population by using analytical tools on the sample data. | Descriptive statistics are used to quantify the characteristics of the data. |
| Hypothesis testing and regression analysis are the analytical tools used. | Measures of central tendency and measures of dispersion are the important tools used. |
| It is used to make inferences about an unknown population | It is used to describe the characteristics of a known sample or population. |
| Measures of inferential statistics are t-test, z test, linear regression, etc. | Measures of descriptive statistics are variance, range, mean, median, etc. |
Advantages of Inferential Statistics
- Generalization: Allows conclusions about a population based on a smaller sample.
- Hypothesis Testing: Facilitates evaluation of research questions and claims.
- Predictive Insights: Enables forecasting future trends or outcomes.
- Flexibility: Applicable across various disciplines and research scenarios.
Limitations of Inferential Statistics
- Sampling Errors: Results may not be accurate if the sample is not representative.
- Dependence on Assumptions: Requires assumptions like normality, which may not always hold.
- Complexity: Statistical tests and models can be challenging for non-experts.
- Risk of Misinterpretation: Misuse or misunderstanding of p-values or confidence intervals can lead to incorrect conclusions.
Tips for Effective Use of Inferential Statistics
- Choose the Right Test: Match the statistical method to your research question and data type.
- Ensure Sample Representativeness: Use proper sampling techniques to reduce bias.
- Understand Assumptions: Verify that data meets the assumptions of the chosen statistical method.
- Report Results Clearly: Include confidence intervals, p-values, and effect sizes for transparency.
- Combine with Context: Interpret statistical findings in the context of your research area.
REFERENCES
- Bhandari, P. (2023, June 22). Inferential Statistics | An Easy Introduction & Examples. Scribbr. Retrieved February 19, 2025, from https://www.scribbr.com/statistics/inferential-statistics/
- Gravetter, F. J., & Wallnau, L. B. (2020). Statistics for the Behavioral Sciences. Cengage Learning.
- Field, A. (2017). Discovering Statistics Using IBM SPSS Statistics. Sage Publications.
- Babbie, E. R. (2020). The Practice of Social Research. Cengage Learning.
- Trochim, W. M. K. (2021). The Research Methods Knowledge Base. Atomic Dog Publishing.
- Agresti, A. (2018). Statistical Methods for the Social Sciences. Pearson Education.
Stories are the threads that bind us; through them, we understand each other, grow, and heal.
JOHN NOORD
Connect with “Nurses Lab Editorial Team”
I hope you found this information helpful. Do you have any questions or comments? Kindly write in comments section. Subscribe the Blog with your email so you can stay updated on upcoming events and the latest articles.


