


Cluster analysis is a statistical method used in data mining and machine learning to group a set of objects in such a way that objects within a group (or cluster) are more similar to each other than to those in other clusters.
By identifying natural groupings in data, cluster analysis can reveal patterns, relationships, or structures that may not be immediately obvious. It is widely applied in fields such as marketing, biology, pattern recognition, and social network analysis.
When Is Cluster Analysis Useful?
Cluster analysis helps us understand data and detect patterns. In certain cases, it provides a great starting point for further analysis. In other cases, it can give you the greatest insights from the data. Here are some cases when cluster analysis is more appropriate than other methods like standard deviation or correlation.
Should I Use Cluster Analysis?
- If you have large and unstructured data sets, it can be expensive and time-consuming to label groups manually. In this case, cluster analysis provides the best solution to divide your data into groups.
- When you don’t know the number of clusters in advance, cluster analysis can provide the first insight into groups that are available in your data set.
- When you need to detect outliers in your data, cluster analysis provides an effective method compared to traditional outlier detection methods, such as standard deviation.
- Cluster analysis can help you detect anomalies. While outliers are observations distant from the mean, they don’t necessarily represent abnormalities. On the other hand, anomalies relate to identifying rare events or observations that deviate greatly from the mean.
Key Goals of Cluster Analysis:
- Data Reduction: Condensing a large amount of data into a manageable number of groups.
- Pattern Recognition: Identifying natural groupings in data without pre-labeled categories.
- Outlier Detection: Identifying unusual or distinct observations that do not belong to any cluster.
Properties of Clustering:
1. Clustering Scalability: Nowadays there is a vast amount of data and should be dealing with huge databases. In order to handle extensive databases, the clustering algorithm should be scalable. Data should be scalable, if it is not scalable, then we can’t get the appropriate result which would lead to wrong results.
2. High Dimensionality: The algorithm should be able to handle high dimensional space along with the data of small size.
3. Algorithm Usability with multiple data kinds: Different kinds of data can be used with algorithms of clustering. It should be capable of dealing with different types of data like discrete, categorical and interval-based data, binary data etc.
4. Dealing with unstructured data: There would be some databases that contain missing values, and noisy or erroneous data. If the algorithms are sensitive to such data then it may lead to poor quality clusters. So it should be able to handle unstructured data and give some structure to the data by organising it into groups of similar data objects. This makes the job of the data expert easier in order to process the data and discover new patterns.
5. Interpretability: The clustering outcomes should be interpretable, comprehensible, and usable. The interpretability reflects how easily the data is understood.
Cluster analysis algorithms
Your choice of cluster analysis algorithm is important, particularly when you have mixed data. In major statistics packages you’ll find a range of preset algorithms ready to number-crunch your matrices.
K-means and K-medoid are two of the most suitable clustering methods. In both cases (K) = the number of clusters.
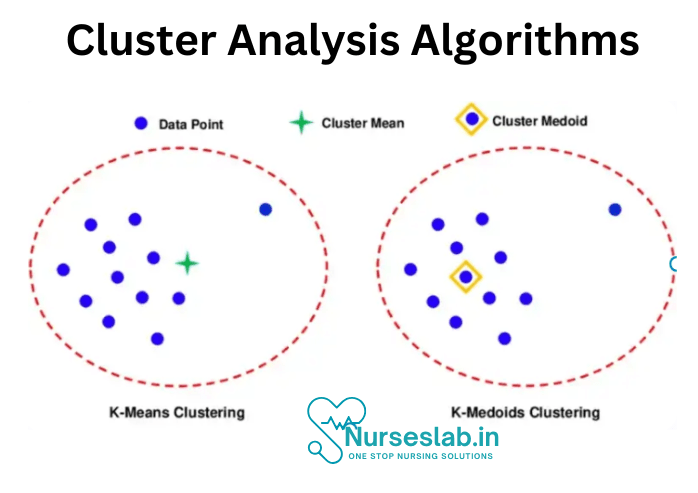
K-means
- Approach: Uses centroids to partition data into clusters.
- Strengths:
- Efficient for large datasets.
- Works well for well-separated clusters.
- Limitations:
- Sensitive to outliers and noise.
- Requires choosing K beforehand.
K-Medoid
- Approach: Uses actual data points (medoids) rather than centroids.
- Strengths:
- More robust against outliers.
- Works well with non-linear clusters.
- Limitations:
Less scalable for very large datasets.
Computationally more expensive than K-Means.
What is our objective with this data?
We hope to group sample sites together into clusters that share similar species compositions as determined by some measure of association. There are several options to measure association. Two common measures are listed below:
- The measure of Association between Sample Units: We need some way to measure how similar two subjects or objects are to one another. This could be just about any type of measure of association. There is a lot of room for creativity here. However, SAS only allows Euclidean distance (defined later).
- The measure of Association between Clusters: How similar are two clusters? There are dozens of techniques that can be used here.
Approaches to the cluster analysis
The approaches generally fall into three broad categories:
- Hierarchical methods
- In agglomerative hierarchical algorithms, we start by defining each data point as a cluster. Then, the two closest clusters are combined into a new cluster. In each subsequent step, two existing clusters are merged into a single cluster.
- In divisive hierarchical algorithms, we start by putting all data points into a single cluster. Then we divide this cluster into two clusters. At each subsequent step, we divide an existing cluster into two clusters.
- Non-hierarchical methods:
- In a non-hierarchical method, the data are initially partitioned into a set of K clusters. This may be a random partition or a partition based on a first “good” guess at seed points which form the initial centers of the clusters. The data points are iteratively moved into different clusters until there is no sensible reassignment possible. The initial number of clusters (K) may be specified by the user or by the software algorithm.
- The most commonly used non-hierarchical method is MacQueen’s K-means method.
- Model-based methods:
- A model-based method uses a mixture model to specify the density function of the x-variables. In a mixture model, a population is modeled as a mixture of different subpopulations, each with the same general form for its probability density function and possibly different values for parameters, such as the mean vector. For instance, the model may be a mixture of multivariate normal distributions. In cluster analysis, the algorithm provides a partition of the dataset that maximizes the likelihood function as defined by the mixture model. We won’t cover this method any further in this course unit.
Types of Cluster Analysis
Cluster analysis can be categorized based on the nature of the data and the objectives of the analysis. Here are three primary types:
1.Hierarchical Clustering
Hierarchical clustering seeks to build a tree-like structure (dendrogram) that shows the nested grouping of data points and their similarity levels.
It is an agglomerative approach if it starts with each data point as an individual cluster and merges them step-by-step.
Conversely, it is divisive if it starts with a single cluster containing all points and then divides them.
Use Cases: Taxonomy of species in biology, market segmentation, and document classification.
2. Partitioning Clustering
This approach partitions the data into a predefined number of clusters. Each data point is assigned to exactly one cluster.
Common algorithms under this type include k-means and k-medoids.
Use Cases: Customer segmentation, image compression, and pattern recognition.
3. Density-Based Clustering
Density-based clustering focuses on creating clusters based on the density of data points in a region. Areas with high densities are identified as clusters, while sparse regions are identified as noise or outliers.
Popular algorithms include DBSCAN (Density-Based Spatial Clustering of Applications with Noise) and OPTICS (Ordering Points to Identify Clustering Structure).
Use Cases: Geographical data analysis, spatial data mining, and identifying clusters in complex datasets with noise.
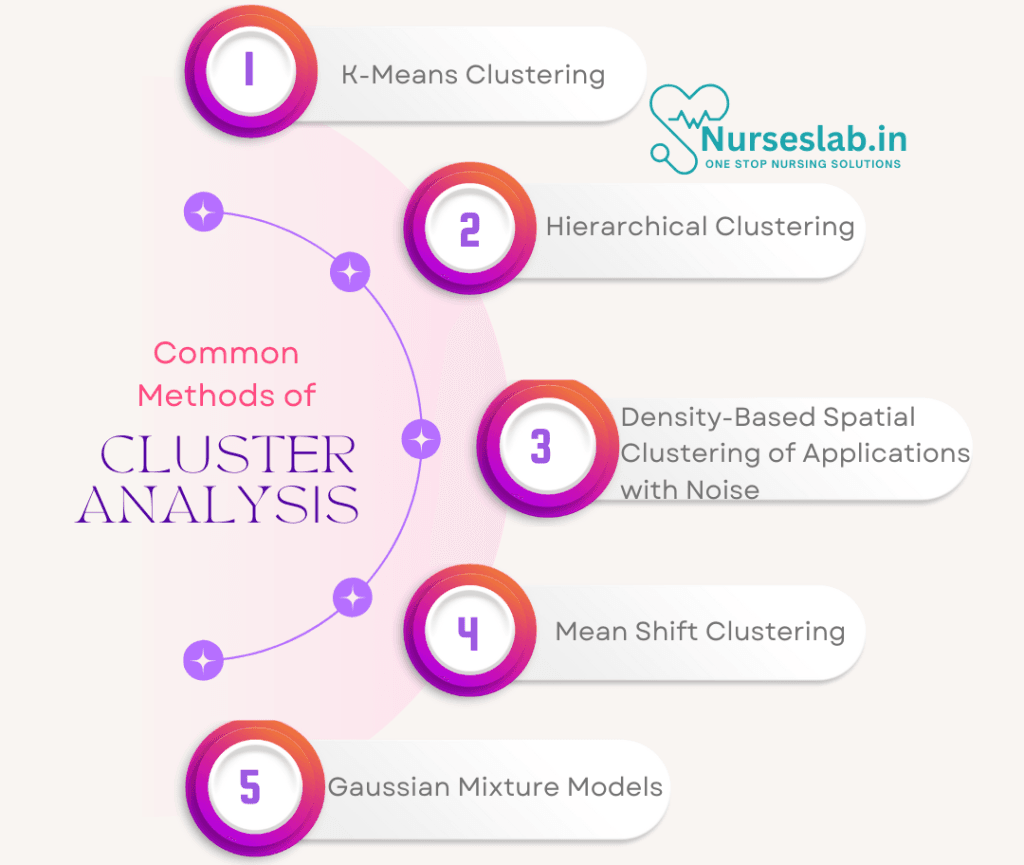
Common Methods of Cluster Analysis
Different algorithms can be used for clustering, depending on the type of data and the desired outcome. Here are some commonly used clustering methods:
1. K-Means Clustering
- Description: K-means is a popular partitioning algorithm that divides data into a predefined number of clusters (k). It iteratively assigns each data point to the nearest cluster center and updates the cluster centers until convergence.
- Advantages: Simple, efficient, and works well with large datasets.
- Limitations: Requires prior knowledge of the number of clusters (k) and can struggle with clusters of varying shapes and densities.
- Example: A retail store can use k-means clustering to segment customers into distinct groups based on purchasing behavior, helping tailor marketing strategies for each group.
2. Hierarchical Clustering
- Description: Hierarchical clustering builds a hierarchy of clusters either by iteratively merging small clusters (agglomerative) or by dividing a large cluster (divisive). The output is a dendrogram, which visualizes the hierarchical structure of clusters.
- Advantages: Does not require a predetermined number of clusters and provides a clear visual structure.
- Limitations: Computationally intensive, especially with large datasets.
- Example: Hierarchical clustering can be used in genetics to create a taxonomy of genes based on similarity in expression patterns, leading to insights into genetic relationships.
3. DBSCAN (Density-Based Spatial Clustering of Applications with Noise)
- Description: DBSCAN groups data points based on density, identifying dense regions as clusters and sparse regions as noise. Unlike k-means, it does not require a predefined number of clusters and can find clusters of arbitrary shapes.
- Advantages: Handles noise effectively and identifies clusters with irregular shapes.
- Limitations: May struggle with data of varying densities and requires careful tuning of parameters (e.g., epsilon distance).
- Example: DBSCAN is useful in geographical data analysis, such as identifying hotspots in urban traffic data where vehicles cluster at specific intersections.
4. Mean Shift Clustering
- Description: Mean shift clustering is a non-parametric, iterative algorithm that identifies clusters by shifting data points toward high-density areas. It doesn’t require a fixed number of clusters and adapts based on the data distribution.
- Advantages: Works well with arbitrary-shaped clusters and does not need a predefined number of clusters.
- Limitations: Computationally expensive for large datasets.
- Example: Mean shift clustering can be used in image processing to identify color-based regions in an image, creating segments for further analysis.
5. Gaussian Mixture Models (GMM)
- Description: GMM is a probabilistic model that assumes data points are generated from a mixture of several Gaussian distributions. It assigns data points to clusters based on probabilities, offering flexibility in modeling clusters of various shapes and densities.
- Advantages: Handles overlapping clusters and provides probabilistic cluster assignments.
- Limitations: Requires careful tuning of parameters and can be computationally expensive.
- Example: In finance, GMM can help model different asset returns by grouping them based on historical returns, accommodating overlapping behavior.
Example of Cluster Analysis Application
Customer Segmentation in E-commerce
A large online retailer wants to better understand its customer base to personalize marketing efforts. Using cluster analysis, the retailer can group customers based on their purchasing behavior, browsing history, and demographics.
- Data Collection: Customer purchase records, browsing behavior, age, location, and spending habits are collected.
- Clustering Method: The company uses k-means clustering to divide customers into 5 clusters based on the similarity of their behaviors.
- Analysis and Interpretation:
- Cluster 1: Frequent shoppers with high spending, interested in premium products.
- Cluster 2: Price-sensitive customers who make purchases during sales.
- Cluster 3: New customers exploring various products.
- Cluster 4: Occasional shoppers focused on specific categories (e.g., electronics).
- Cluster 5: Inactive users with low purchase history.
- Actionable Insights: The retailer can tailor marketing strategies for each segment:
- Target Cluster 1 with exclusive offers on high-end products.
- Engage Cluster 2 with timely promotions during sales events.
- Send personalized recommendations to Cluster 3 to increase conversions.
Through this analysis, the retailer can increase engagement and optimize marketing strategies for different customer types, leading to increased sales and customer satisfaction.
Applications Of Cluster Analysis:
- Cluster analysis has applications in many disparate industries and fields. Here’s a list of some disciplines that make use of this methodology.
- Marketing: Cluster analysis is popular in marketing, especially in customer segmentation. This method of analysis helps to both target customer segments and perform sales analysis by groups.
- Business Operations: Businesses can optimize their processes and reduce costs by analyzing clusters and identifying similarities and differences between data points. For example, you can identify patterns in customer data and improve customer support processes for a particular group that may require special attention.
- Earth Observation: Using a clustering algorithm, you can create a pixel mask for objects in an image. For example, you can use image segmentation to classify vegetation or built-up areas in a satellite image.
- Data Science: We can use cluster analysis for predictive analytics. By applying machine learning techniques to clusters, we can create predictive models to make inferences about a particular data set.
Advantages of Cluster Analysis:
- It can help identify patterns and relationships within a dataset that may not be immediately obvious.
- It can be used for exploratory data analysis and can help with feature selection.
- It can be used to reduce the dimensionality of the data.
- It can be used for anomaly detection and outlier identification.
- It can be used for market segmentation and customer profiling.
Disadvantages of Cluster Analysis:
- It can be sensitive to the choice of initial conditions and the number of clusters.
- It can be sensitive to the presence of noise or outliers in the data.
- It can be difficult to interpret the results of the analysis if the clusters are not well-defined.
- It can be computationally expensive for large datasets.
- The results of the analysis can be affected by the choice of clustering algorithm used.
- It is important to note that the success of cluster analysis depends on the data, the goals of the analysis, and the ability of the analyst to interpret the results.
REFERENCES
- Kaufman, L., & Rousseeuw, P. J. (2009). Finding Groups in Data: An Introduction to Cluster Analysis. Wiley.
- Novoselsky, Alexander & Kagan, Eugene. (2021). An introduction to cluster analysis. 10.13140/RG.2.2.25993.57448/1.
- Everitt, B., Landau, S., Leese, M., & Stahl, D. (2011). Cluster Analysis. Wiley.
- Hastie, T., Tibshirani, R., & Friedman, J. (2009). The Elements of Statistical Learning: Data Mining, Inference, and Prediction. Springer.
- Rokach, L., & Maimon, O. (2005). Data Mining and Knowledge Discovery Handbook. Springer.
- https://www.geeksforgeeks.org/data-mining-cluster-analysis/
- https://builtin.com/data-science/cluster-analysis
- https://online.stat.psu.edu/stat505/book/export/html/742
Stories are the threads that bind us; through them, we understand each other, grow, and heal.
JOHN NOORD
Connect with “Nurses Lab Editorial Team”
I hope you found this information helpful. Do you have any questions or comments? Kindly write in comments section. Subscribe the Blog with your email so you can stay updated on upcoming events and the latest articles.


